Evolution of Ad Spend and the Dynamics of Digital
1. Digital Advertising: Times They Are A’ Changin
Advertising, both digital and traditional, is constantly evolving. One major advantage of digital advertising is that it can dramatically reduce costs through automation. Personalised advertising benefits advertisers by targeting likely customers, building loyalty, increasing sales, and reducing wastage (ads that are paid for but seen by audiences that are unlikely to be interested in the product). Due to these characteristics, personalised advertising is also significantly cheaper. That, in part, explains the growing share of advertising dollars that are spent on digital advertising. This growth is often framed as a sign of creeping market power of companies active in the digital advertising industry (e.g. Google, Facebook, Amazon, Spotify, etc.) as against traditional media outlets (TV, newspapers, radio, etc.). A few years ago we showed that this wasn’t the case, that traditional advertising formats still attracted the majority of total ad spend. Recent figures show that while that may still be the case on a global basis, in certain countries, like the USA, spend on digital advertising has finally taken the lead, and the COVID-19 crisis may well accelerate this trend.
2. Data: Let’s Take A Look Under The Hood
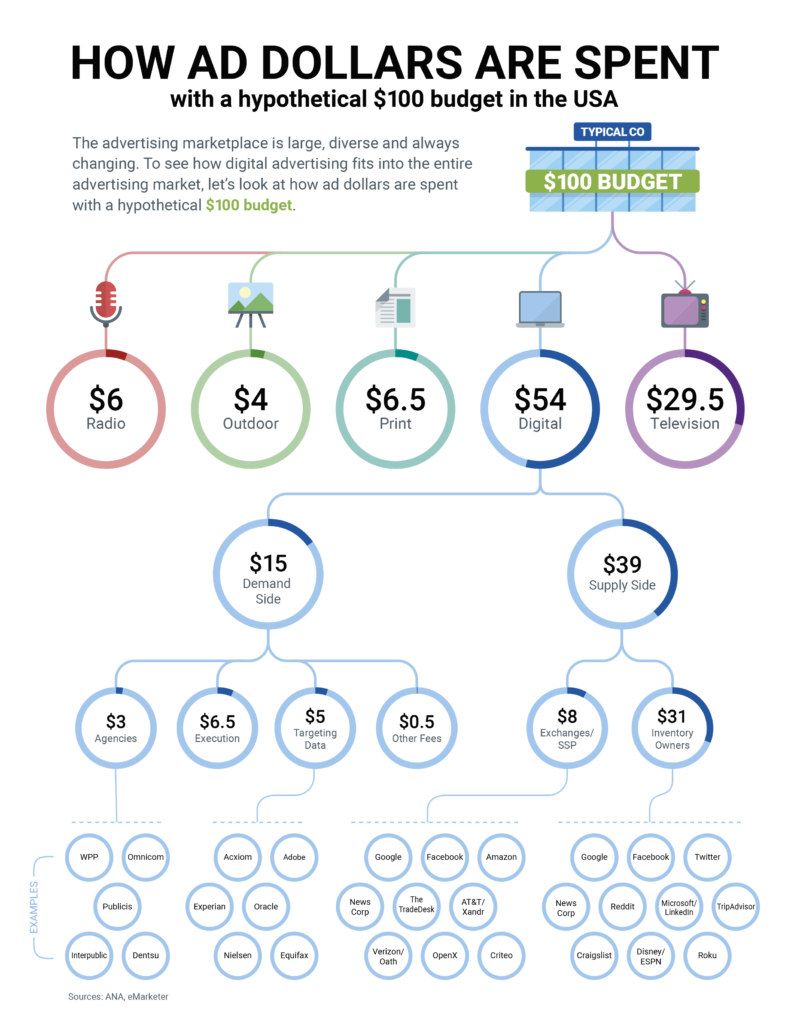
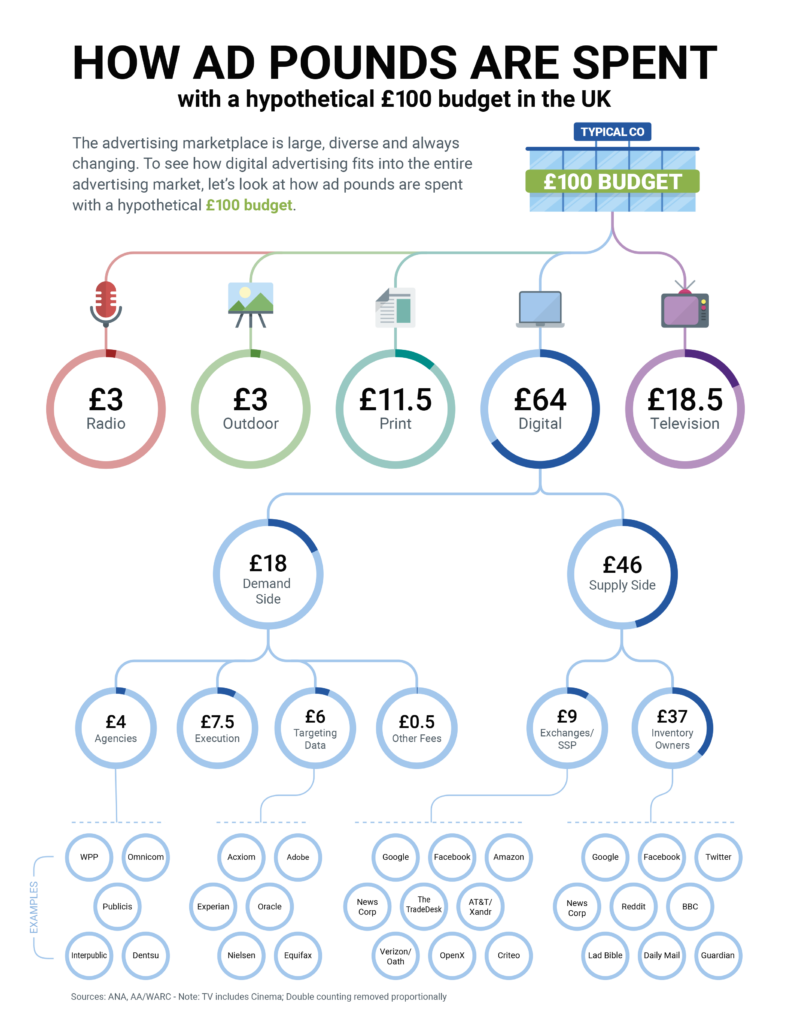
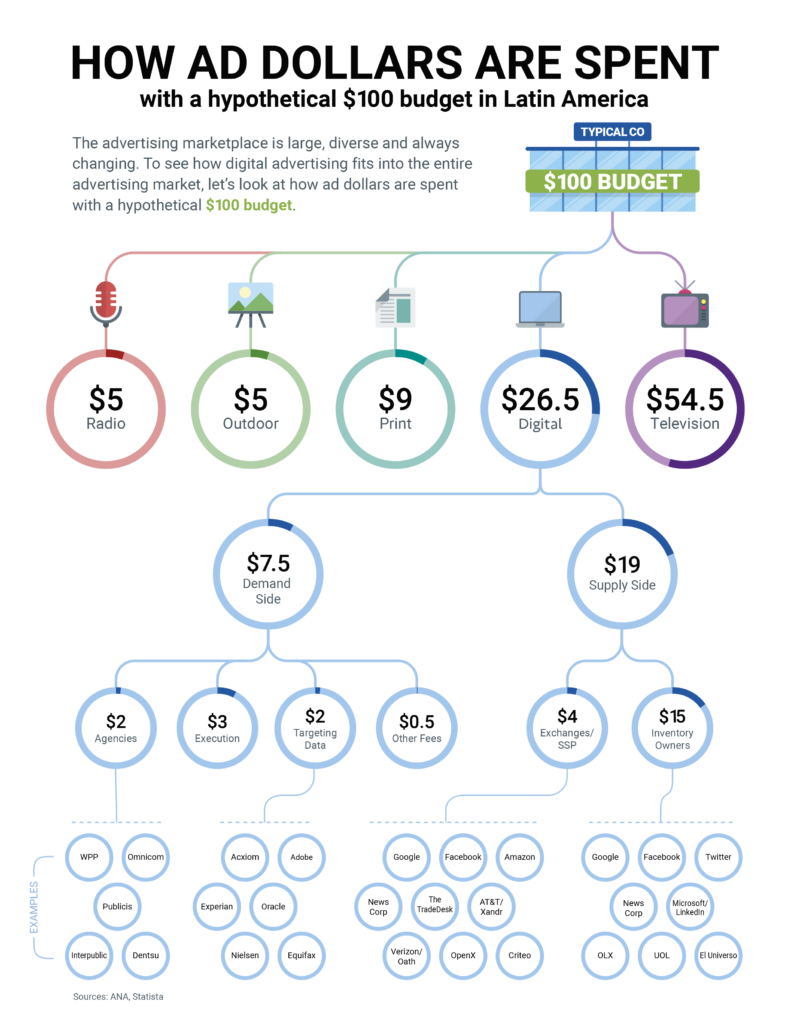
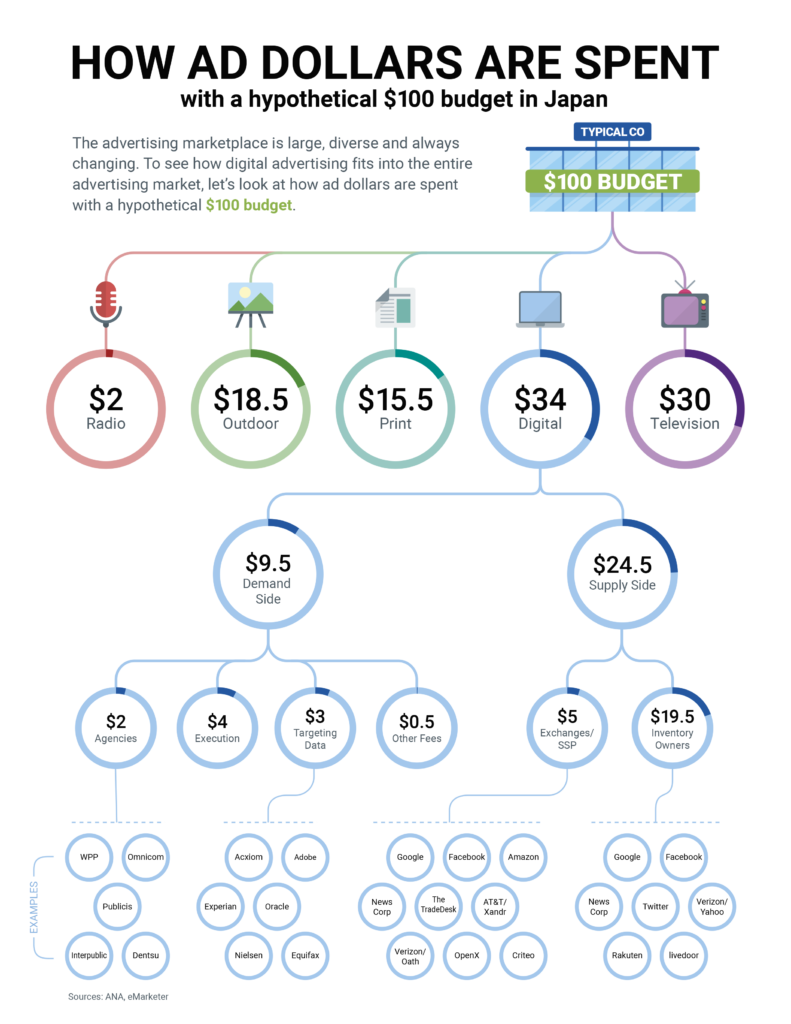
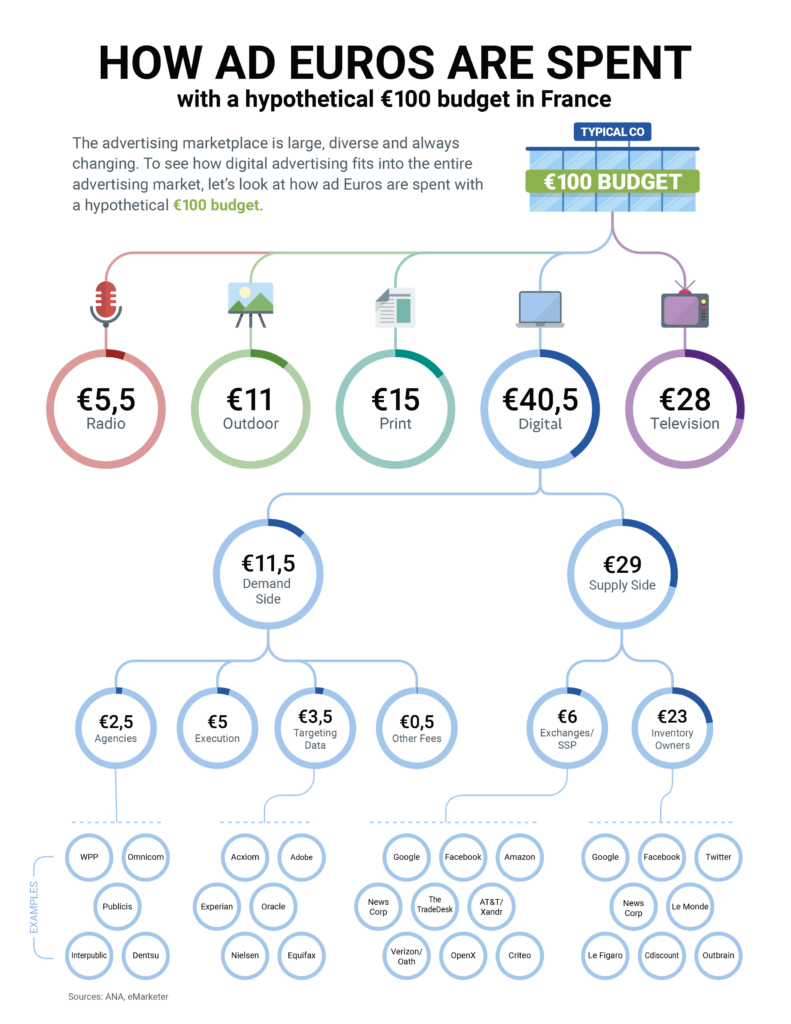
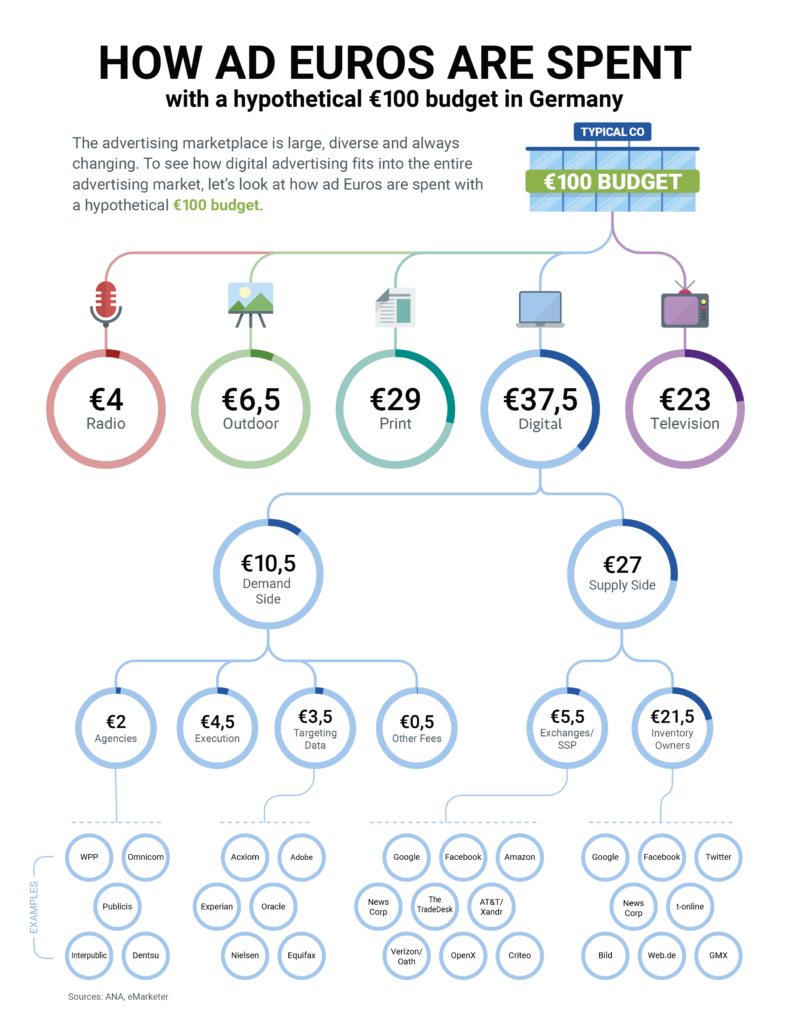
Using data from the Association of National Advertisers, eMarketer, Statista, and other 3rd-parties, these graphics illustrate the economics of an advertising campaign, and the proportion of digital and traditional advertising formats (radio, outdoor/billboards, print, and television).¹
Digital advertising itself can be broken down through its own value chain.This diverse and dynamic digital advertising ecosystem can be divided into the following sub-segments from the “demand side” to the “supply side”. Advertisers (i.e. those who want to purchase advertising for their product) typically first approach (1) agencies, which design, create, plan, and manage advertising for a product (though advertisers are increasingly building out agency functions in-house); (2) execution functions are typically done by agencies and smaller boutiques, and involve the implementation of the ad campaign and verification; (3) targeting data is used by nearly all digital ad campaigns to identify the most effective audience for the ad campaign, and while it can come from the advertisers themselves, it is also often supplemented by third-parties; (4) ad exchanges / supply-side platforms then take the advertising campaign as planned by the agency and automatically insert the advertising into the relevant advertising inventory slots, which are provided by (5) inventory owners who produce the site, service, or content that delivers the advertisement to the viewer (e.g. via website, app, or podcast). Inventory owners are often called “media owners” (given the historic link between advertising and media ownership like publishing or broadcast television).
3. Geographical Preferences: You Say Tomato
Using a hypothetical company spending a $100 budget in a fashion representative of the overall ad space, the graphics contextualize a typical expenditure to illustrate how much ad spend goes where, rounded off to the nearest dollar. Naturally, different advertisers will pursue different strategies; a given advertiser might spend its entire budget on radio. As the graphics shows, however, an average advertiser that spends a $100 budget in a representative way would spend about $29 on television in the US, but significantly less in the UK.
That’s not the whole story though. Traditional media is still key for building brand awareness, while targeted advertising tends to use this built up brand equity to activate purchase activity and increase sales. In this way, brand building and activation work in synergy, and hence traditional advertising formats are not going away anytime soon. This is particularly true in some of the fastest growing markets in the world.
As can be seen from the charts above, in Latin America, television still dominates, with $54 of every $100 of advertising spend, while in Japan sizeable amounts, $18.50 of every $100, are still spent on outdoor advertising. This shows that what advertisers deem as most effective in the US and UK is not the case elsewhere. However, this too may change. Advertisers continually shift budgets among platforms to maximize the return on their ad spend. For now, however, traditional media spending in France and Germany is also ahead of spending on digital formats. As can be seen from the below.
In Germany, 28% of advertising spend is still focused on print. Money goes where the eyeballs are, and Germans still spend over 6 hours with traditional media per day. This too is changing. But that doesn’t mean the death of traditional newspaper, television or radio industries, far from it!
4. Who Wants a Piece of the Growing Digital Pie?
What these numbers show is that digital formats are growing in popularity, an eminently sensible trend. Launching an ad campaign using digital formats is cheaper (by some estimates, over 90% cheaper), more customisable, more targetable, and provides instant feedback and far superior measurement features. Once digital advertising became widely available in Australia, the United States, France, and Germany, the share of GDP going to advertising dropped by roughly 25%. Advertisers were spending less, for the same results.
And that is why newspaper, television and radio industries are increasingly meeting competition by adopting digital innovations and offering their advertiser customers the same value. Not only are they still drawing in about half of total advertising spend, they’re also part of the group of “inventory owners” where nearly 60% of digital ad spend goes. Those “inventory owners” include the websites and digital services of all the major newspapers, magazines, radio and TV stations. In other words, they’re generating revenue from both non-digital and digital ad spend. It’s also worth noting that programmatic intermediary fees are decreasing, suggesting a healthy level of competition in the ad-tech stack. And those are just average fees, given the wide range of content (from premium to amateur), the proportion going to inventory owners can vary widely as well (and various technologies, like ads.txt, are making the market more transparent, and facilitating this price differentiation).
Spurred by competition from social media and other types of ad-supported digital media, traditional industries have finally come around to the benefits of personalised advertising and have begun investing in the technologies necessary to offer it to their customers. This trend has been driving innovation in the publishing space already for quite some time. For example, between 2014 and 2017 in the UK, national news publishers increased their overall cross-platform readership – i.e. accounting for consumption on mobile or PC as well as print – by an average of 51%, and news publishers’ UK digital advertising revenue grew by 60% from 2012 to 2017. And approximately 1/3 of news publishers’ digital ad revenue comes from referral traffic generated by news aggregators like search and social media. News publishers are not only using existing digital tools to increase their reach, they are also entering the ad-tech stack, and building out solutions tailored to their needs. For example, in June of 2019, programmatic advertising platform The Ozone Project, a collaboration between the Guardian News & Media, News UK, The Telegraph and Reach, partnered with advertising exchange OpenX to increase monetisation of publisher’s digital ads. Meanwhile, the global podcast advertising market grew an estimated 42% between 2018 and 2019, and is expected to reach more than USD 1 billion by 2021, and digital out-of-home advertising is predicted to grow to grow 28% globally by 2023.
5. Must See TV
Of all the traditional media formats, television is probably having the most exciting evolution. Traditional television broadcasters still hold the “crown jewels” in advertising through their access to incredibly valuable content (think Olympics and Fifa World Cup). Now, broadcasters are finally taking advantage of the technologies available to them through smart TVs, set-top-boxes and internet enabled streaming sticks (which have long been available, TiVo’s first box launched in early 1999, Apple TV in 2007, and Roku in 2008). Personalised advertising in television, sometimes referred to as “addressable” or “programmatic” advertising, is booming.
It might surprise you to learn that two people watching the same broadcast television program might watch completely different ads during the traditional ad break, provided that the incumbent media suppliers take advantage of the technologies available to them. Through personalised advertising on television, advertisers get lower costs, better targeting, higher returns, and more effective advertising. But they’re also benefiting from the traditional advantages of television. As Olivier Jollet, managing director of PlutoTV Europe has said:
“We used to have two worlds in the advertising world. The TV budget world with a strong focus on brand awareness for the advertisers, and the digital world with a focus on conversion and engagement. AVOD [Advertising-based Video On Demand] platforms where most of the usage is taking place in the living room, such as Pluto TV, are bringing the best of both worlds together: TV-like inventory with the measurement and targeting capacities of the digital world.”
Personalised advertising is also a big hit with viewers. According to studies done by one broadcaster who made the switch, personalised television advertising increases the enjoyment of TV advertising up to 10% and reduces channel switching. It’s no wonder then that personalised television advertising is estimated to represent 10% of total television advertising by 2022, and that 68% of marketers believe that at least half of traditional linear TV advertising will be targetable within five years.
This merging of great content and personalisation is set to take off in the coming decade. Many technology companies, like AT&T (HBO, Hanna-Barbera, Warner Bros., DC Entertainment), Sony (Sony Pictures), and Comcast (DreamWorks, NBC Universal), already own vast amounts of content out-right. At the same time, more content owners are offering sophisticated direct-to-consumer options like Disney (Disney+ / Hulu), and the National Basketball Association (which recently announced a partnership with Microsoft “to redefine and personalize the fan experience”).
6. Winners and Winners
It’s an exciting time to be in the advertising business, as technologies have matured and demand has grown. The current crisis may be accelerating these trends, as traditional companies increasingly turn to digital delivery formats. Once this current crisis is over, and we return to a new normal, total advertising spend will continue to grow, and digital advertising will play a large part. Pressure on digital native advertisers will only get more intense as traditional media companies increasingly exploit the benefits of personalised digital advertising, whether via podcasts, news apps, or traditional television. This kind of competition likely means continued value gains for advertisers, plentiful opportunities for creative content producers, and lots of great content for consumers.

